If you want to succeed in trading, understanding crypto chart patterns is one of the most important skills to learn. It doesn’t matter if you are a beginner or an expert, chart reading helps you make smarter and profitable trading decisions.
If you trade Bitcoin, Ethereum, or any altcoin, the insights here will help you read crypto trading charts with confidence and accuracy as this guide breaks down everything you need to know about how to analyze crypto chart patterns.
What Are Crypto Charts?
Crypto charts are visual tools that display how a cryptocurrency’s price has changed over time. These charts depict market trends, showing whether prices are rising, falling, or remaining flat.
Most trading platforms provide crypto guide to help customers follow asset performance, forecast price movements, and analyze entry and exit locations.
Notably, the data displayed on crypto trading charts is based on historical prices and volumes, which may be changed to illustrate changes over minutes, hours, days, weeks, months, or years.
What Are Crypto Chart Patterns?
Crypto chart patterns, on the otherhand, are visual formations on price charts that predict likely future moves based on previous behavior. Crypto traders use them to forecast market direction, identify trends, and determine entry and exit points. Generally, crypto chart patterns are classified into three types: continuation, reversal, and bilateral.
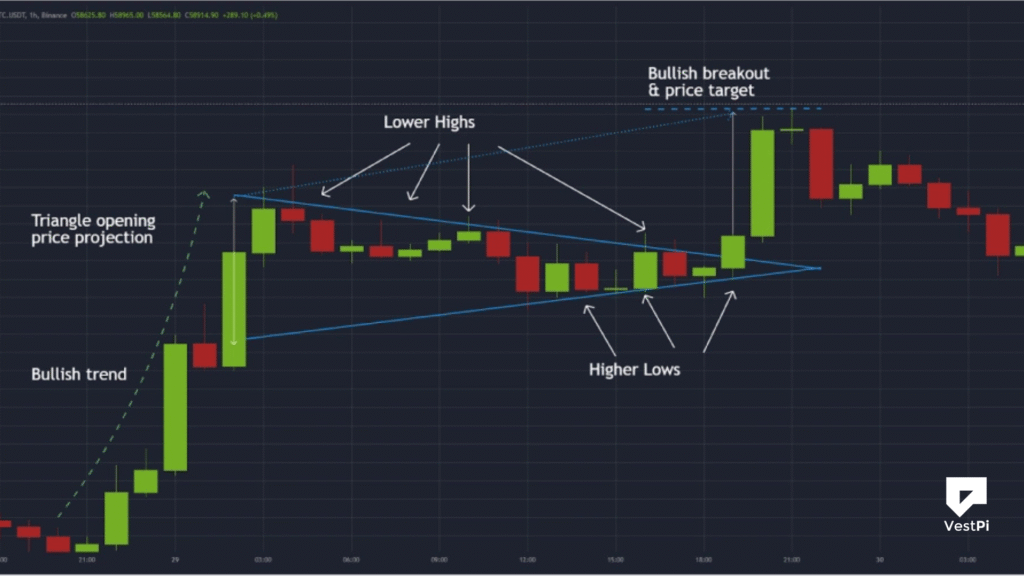
Continuation patterns signal that the current trend will continue. Flags, pennants, and triangles are among the most common. For example, a bullish flag in an uptrend indicates that the price will increase further after a little consolidation.
Reversal patterns suggest that a trend is about to alter. Key examples include the head and shoulders (bearish reversal), inverse head and shoulders (bullish reversal), double tops, and double bottoms. Identifying this can assist traders in acting before a significant shift happens.
Meanwhile, bilateral patterns, such as symmetrical triangles, indicate that the price could break out in either direction, necessitating confirmation before proceeding.
These patterns are particularly effective when paired with technical indicators such as volume, MACD, and RSI. Notably, no pattern guarantees results, but recognizing them allows traders to make informed selections.
Why Reading Crypto Chart Patterns Matter?
As a trader, t is vital to how to read crypto charts since it offers a critical advantage for anyone involved in cryptocurrency trading. Whether you’re a newbie or an experienced trader, charts can help you make better and more confident selections. Here’s why this talent is so important.
1. Makes You a Smarter Trader
Crypto charts depict how the price of a coin fluctuates over time. In summary, learning to read crypto trading charts provides insight into where the market has been, where it may go, and when to enter or quit deals.
Charts also highlight trends, patterns, and critical price levels, allowing you to avoid guessing and instead trade based on evidence.
For example, a “double bottom” pattern could indicate a possible price rebound. Instead of reacting emotionally, you base your selections on a visual representation of the market.
2. Helps You Time Your Trades
As we all know, prices can rise or decrease in minutes, thus, signalling the importance of timing in cryptocurrency trading and investment.
Learning how to read crypto trading charts will allow you to spot support and resistance zones, breakouts and breakdowns, and market entrance and exit points.
This allows you to purchase low and sell high, or to sell short when a drop is expected.
3. Reduces Emotional Trading
If you don’t know how to interpret cryptocurrency trading charts, you’re more likely to rely on emotions or social media excitement.
This leads to poor decision-making and costly blunders. Notably, charts provide objective data, which alleviates worry and terror.
For example, instead of panic selling during a downturn, crypto trading charts may reveal that it is merely a little correction in a wider rally.
4. Benefits Both Beginners and Expert Traders
While basic trading chart indicators can help beginners learn about market movements and gain confidence, experienced traders rely on complex patterns and tools to fine-tune their tactics.
Furthermore, charts are the cornerstone of any effective trader’s toolset, regardless of experience level.
5. Reflects Overall Market Psychology
Crypto trading charts offer more than just the price; they also reflect how traders think and feel.
Each candlestick represents a conflict between buyers and sellers. As a result, knowing how to read cryptocurrency trading charts is similar to learning how to read the market’s emotions and reactions.
For example, a long red candle may signal panic selling, whereas a rising succession of green candles may represent increased confidence.
Types of Crypto Charts
Different sorts of charts provide varying viewpoints. These are the most common:
- Line Charts: These are the most basic charts. They draw a line that connects closing prices throughout time. While line charts are ideal for novices since they are clean and simple to comprehend, they do not display all price activity (such as highs and lows).
- Candlestick Charts: These are the most common chart types in cryptocurrency trading. Each “candle” represents the open, high, low, and close prices for a specific time period. While candlestick charts may appear complicated at first look, they provide a comprehensive view of price movement and market trends.
- Bar Charts: They are similar to candlesticks, except they are portrayed as vertical lines with horizontal ticks indicating open and close prices. They are less visually appealing but more compact and detailed.
- Heikin-Ashi Charts: These are modified candlesticks that smooth out price activity to aid trend detection. They are better at displaying clear patterns but do not provide exact prices.
Why Traders Prefer Candlestick Charts?
Candlesticks are popular among traders because they can convey a lot of information in a small amount of space. A single candlestick can reveal market mood, including buyer or seller dominance and intensity. This helps to determine the power balance between bulls and bears.
Candlesticks also make it easier to identify specific price patterns that can indicate what may happen next. Traders employ well-known candlestick patterns to predict short-term price movements, which will be discussed momentarily.
What Are Bullish and Bearish Candlestick Patterns?
Candle patterns can predict future price changes. Traders have found dozens of candlestick patterns, but let us focus on a few well-known bullish and bearish ones:
- Bullish Engulfing Pattern: A traditional two-candle bullish reversal pattern. The first candle is a little bearish (down) candle, followed by a larger bullish (up) candle that totally engulfs the previous candle. This indicates that buyers outpaced sellers, implying that the slump may be reversing.
- Bearish Engulfing Pattern: A bearish engulfing pattern is characterized by a little up candle followed by a large down candle that engulfs it. This suggests that sellers have regained control, and a negative reversal may be imminent.
- Hammer and Hanging Man: The hammer represents a bullish trend. It often comes after a downturn and suggests that buyers jumped in firmly to establish a bottom. The hanging man pattern, characterized by a lengthy lower wick and a small body, might indicate a bearish reversal at the peak of an uptrend. Consider it the market “hanging” before a decline.
- Doji: Doji candles have almost identical open and shut times. The wicks may be long or short. A doji symbol represents market hesitation, since neither buyers nor sellers can dominate. Dojis frequently appear in reversal patterns. For example, a doji following a sequence of down candles could indicate that buyers are entering the market.
These are just a few examples; there are many other candlestick patterns. Traders use candlestick patterns to forecast future trend shifts. For example, a bullish pattern may indicate that it is a good time to buy, but a bearish pattern may indicate that profits should be taken.
Remember that no pattern is 100% trustworthy on its own; they perform best when combined with additional indicators or trend analysis.
How to Read Crypto Charts Using On-Chain Metrics
If you must become proficient in interpreting charts, you simply need to practice often. Here’s how to become comfortable doing that:
- Begin with longer timeframes before zooming in.
- Look for trends rather than just price points.
- Avoid utilizing too many indications. Keep it basic.
- Use demo accounts or paper trading tools to practice.
- Follow the trend: Do not trade against the market direction.
Key Elements of a Crypto Trading Chart?
Crypto trading charts serve as the foundation for technical analysis. They offer a visual representation of market pricing behaviour, trends, and momentum. Understanding these chart aspects is crucial for making informed decisions and reducing risk.
1. Price
The vertical axis either on the right (or left) side of the chart shows the price of the crypto asset. It updates in real time, allowing traders to monitor price changes over time.
Why does this matter? It allows you to assess the cryptocurrency’s value at any given time and compare it to previous highs and lows. You can also use it to determine stop-loss and take-profit levels based on previous support and resistance zones.
2. Timeframes
Understanding the context of price fluctuation is impossible without knowing the time frame. As a result, the horizontal axis of a cryptocurrency trading chart displays the selected time frame, which can range from 1 minute (1m) to 1 year (1M) or more.
Shorter timeframes (1m, 5m, 15m) are particularly suitable for scalpers and day traders. Swing traders and investors employ longer periods (4 hours, 1 day, 1 week, 1 month, etc.) for trend analysis.
3. Candlesticks
Candlesticks are the most prevalent way to display price data on cryptocurrency trading charts. Each candlestick reflects price behavior over a specific timeframe.
Candlestick patterns are useful because they assist traders predict reversals or continuations of trends. Each candlestick displays the following:
- Open: Price of a cryptocurrency at the start of the term.
- Close: A crypto asset’s price at the end of the period.
- High: The highest price obtained within a given period.
- Low: The lowest price achieved within a specific period.
Notably, green or white candlesticks indicate bullish market attitudes, whilst red or black candlesticks indicate bearish market sentiment.
Furthermore, the close price of green or white candlesticks is typically greater than the open price. Meanwhile, the closing price of a red or black candlestick is typically lower than the initial price.
4. Volume Bars
Volume bars, which appear at the bottom of most charts, show how much of the asset was traded in each candle’s time frame. Volume bars are primarily split into two types: tall and low bars.
Tall bars show considerable activity, such as strong buying or selling interest, whereas low bars indicate low activity, which frequently implies indecision or market rest.
Why do volume bars matter during crypto trading chart reading? That’s because volume validates the magnitude of price fluctuations. For example, a price breakout with limited volume is weak and untrustworthy.
5. Technical Indicators
Technical indicators are mathematical computations based on price, volume, or open interest data. They enable traders to assess market data more objectively. Indicators are classified according to their function, such as momentum, trend, and volume.
Momentum indicators, such as the Relative Strength Index (RSI) and stochastic oscillator, determine the speed and strength of a market movement. Momentum indicators are very useful in predicting reversals and warning of price fatigue.
In contrast, trend indicators help traders determine the direction and strength of a trend. Reading crypto trading charts and using trend indicators might help you stay profitable and avoid going against the trend.
Examples include the Moving Average (MA), Simple Moving Average (SMA), Exponential Moving Average (EMA), and Moving Average Convergence Divergence (MACD). Volume-based indicators are another crucial factor to consider when analyzing cryptocurrency trading charts.
The reason for this is that these indicators use trading volume to determine the strength of a price change. These indications also confirm breakouts and reversals. Examples include the on-balance volume (OBV), volume moving average, and accumulation/distribution line.
On-Balance Volume (OBV) combines price and volume to demonstrate buying and selling pressure. In contrast, the volume moving average is a moving average applied to volume bars. Meanwhile, the accumulation and distribution line measures the cumulative movement of money into and out of a cryptocurrency asset.
6. Order Book and Trade Feed
Though not part of the chart itself, some trading systems show the order book, which is a real-time list of buy and sell orders at specified price levels.
They also display the trade stream, which contains a list of recent transactions (volume, price, and time). These components are especially valuable for scalpers and day traders in determining immediate buying and selling pressure.
Final Thoughts
Reading crypto chart patterns is an essential ability for anyone serious about cryptocurrency trading. It allows you to better comprehend price changes, identify trends, and make informed decisions.
However, understanding how to interpret crypto trading charts does not include guessing the market. Rather, it is about knowing what the market is doing at a given time and where it might go next.
When you can comprehend price action, volume, and technical indications, you’ll be better able to make rational decisions rather than emotional ones.